The divergence that forms in the forex market is one of the set ups that many traders look for from time to time. The same with the head and shoulder pattern, it doesn’t show up all the time but when it does, it gives traders a big upper hand over the market.
Divergence is a situation in the market where in the price chart shows a certain direction of the price but the technical indicator such as the Relative Strength Index or RSI shows the opposite direction.
Technical indicators are supposed to mimic the movement of price but in the case of a hidden divergence it shows a different outcome. Seeing this in the chart will make you think that there is something fishy about the market. This abnormality translates to forex trading as a reversal of the current price movement.
To make this all clear and less confusing, I will show you some examples of hidden divergence in the forex market that are hard to see if you don’t know where to look. Divergence in the market occurs on any time frame but in the examples I will be using the 4 hour time frame.
Also, the technical indicator that I will be using is the RSI with its default settings.
There are two types of divergence in the forex market; the bullish divergence and the bearish divergence
- Traders call it bullish divergence when the price action is bearish or down trending but the technical indicator which is the RSI is showing a bullish move or a consolidating move defying the real movement of price which is supposed to be a bearish move.
- Traders call it bearish divergence when the price action is bullish or up trending but the RSI is showing a bearish move or a consolidating move defying the real movement of price which is supposed to be a bullish move.
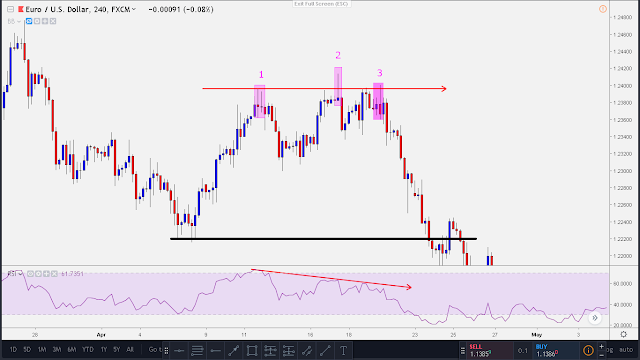
Bearish divergence example in the EURUSD forex pair in the 4 hour time frame
 |
| Click the image to zoom in.. |
Observe that the price is basically showing a sideways direction with a somewhat bullish bias as it created a higher high indicated with the number 2.
But look at the RSI indicator below.
What have you noticed?
The RSI indicator was showing a different data, it is clearly showing us a down
trending graph as indicated with the red arrow going down.
This is how a bearish divergence looks like! Two graphs ( price graph and RSI graph ) showing different facts that are supposed to be the same.
The question now is this..
How to trade this divergence forex set up?
We could confirm that this is a divergence when both graph showing contradicting movements.
All we have to do after that is to wait for a candle stick set up for an entry. We need to wait for a candle stick set up so that we can plan our entry and stop loss point.
Seeing that bearish pin bar formed as indicated with number 3, we can now put on our entry point and stop loss.
Our entry point would be right after the pin bar formed or perhaps you could wait for a little bit of pullback.
Our stop loss placement would then be above that bearish pin bar.
Our logical placement of the profit target would be right at the previous resistance as shown with the black horizontal line.
The final set up of the trade would look like this
 |
| Click the image to zoom in |
I don’t know if there are forex divergence scanner out there but what happened with the market after just shows us how powerful and profitable bearish divergence set up could be if traded correctly. In this particular trade it could have been an easy 1:4 risk to reward ratio winning trade.
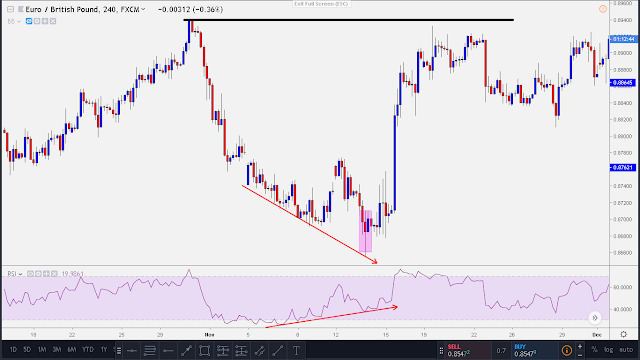
Bullish divergence example in the EURGBP forex pair in the 4 hour time frame
In this pair we could see that the price chart is showing us a down trending price. But when we look at the RSI graph below it, we could clearly see that the graph is showing an uptrend movement as indicated with an upward pointing arrow.
 |
| Click the image to zoom in |
With these we could confirm that this forex pair at this particular time is bullish divergence.
Since this is confirmed already, we can now use our divergence forex system strategy set up.
We wait for a candle stick formation that signals a start of a bullish move.
Observe that a bullish pinbar formed followed by a bullish engulfing candle as indicated with the magenta rectangle.
Our entry point would then be right after that bullish engulfing candle and we put our stop loss below the pin bar.
The logical placement of the profit target would be below the resistance as indicated with the horizontal black line.
The final forex divergence trade set up would look like this
Forex divergence trade set up combined with a reliable candle stick formation will not only give us a great edge in the market but also big profits.
Patiently scan your chart for these kinds of patterns and you will be rewarded.
The big question is that are you willing to wait for this kind of patterns to occur in the market?
See you in the last and final part of this article series!

Your data which you have shared here it's a truly all around investigated and useful article. Continue giving more exhortation later on like this. Much thanks to you. As we provide latest Forex News online then visit at fxgaininfo.com
ReplyDeletetrading is well following these step. thank you for giving information forex trading. For more reviews on forex broker please visit my blog
ReplyDeletehttps://fxreviews.best/tradedwell-review/