Price action formations in the FOREX market seems very random to starting traders. I remember when I first look at a chart 2 years ago I could not mentally form any formation at all.
All seems to be just random ups and downs of the flow of the market. Never did I realize that the ebb and flow of the market is all driven by people’s psychology.
Later on as I put more time in studying and observing how the market moves, I came to conclude that there are certain patterns formed repeatedly.
In this part 4 of these article series, I want to talk about the ever famous head and shoulder pattern formations.
It’s undeniable that there are many patterns out there but this pattern formation is the most or if not one of the most pattern formation traders looked for in the market.
Why do traders look for this head and shoulder patterns?
- First of all it’s easy to recognize because of its obvious formation.
- Second reason is that this set up has a huge probability of forming which means it has high win rate.
- The final reason is that depending on how the pattern forms it usually gives good risk to reward ratio.
Take a look at our example below.
 |
| Click the image to zoom in |
This head and shoulder pattern formed in the EURNZD 4 hour time frame.
As you can see, this pattern formation is quite obvious. Derived from its name itself it is composed of two shoulders and one head..
 |
| Click the image to zoom in |
On trading this kind of pattern, its is best traded right at the formation of the right shoulder. As you can see in the example above. There is a bearish pin bar set up formed in the right shoulder.
Entry point would be right after this pin bar formed.
The stop loss should be placed above the pin bar.
The most logical place for the profit target would be the bottom of the left shoulder which is a known support indicated with a red horizontal line.
This trade set up using the head and shoulder pattern alone could have generated a good 1:6 risk to reward ratio.
The inverted head and shoulder pattern
The inverted head and shoulder pattern is pretty much the same with the usual head and shoulder pattern. It just that this formed in reversed form but mind you the concept is still the same.
 |
| Click the image to zoom in |
This inverted head and shoulder pattern was formed in the NZDUSD pair 4 hour time frame.
In the eyes of those novice traders this might look hard to recognize as a pattern. But the more you put time on studying charts there will come a time when you will be able to recognize this patterns almost instantly.
Since this is an inverted one we should be looking for a set up here to go long. In my own style of trading, the set up would go like this.
 |
| Click the image to zoom in |
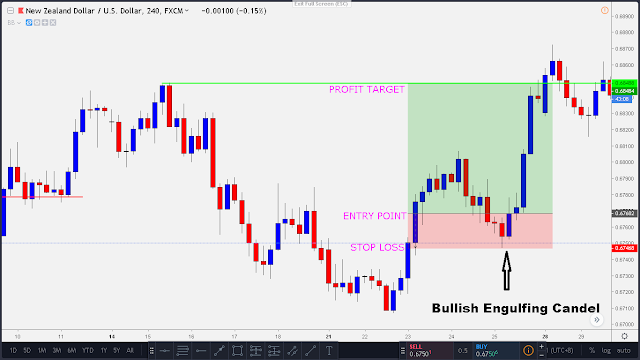
As I have talk about in my previous article about Japanese candle stick formation where the topic is about engulfing candles and its psychology. This bullish engulfing candle here could be our signal that the price would be bullish and will form the inverted pattern.
Our entry would be right after the bullish engulfing candle formation.
Our stop loss must be placed below the candle that had been engulfed.
Our profit target again should be based on the pattern itself. In this inverted one it should be placed at the top of the leg of the left shoulder which is a known resistance indicated with a green horizontal line.
In this particular trade set up, we could have had easily generated a 1:4 risk to reward ratio winning trade.
In summary of this article.
Head and shoulder pattern is literary composed of a HEAD and a SHOULDER which makes it easy to recognize.
If its a usual head and shoulder pattern, look to trade short right at the formation of the RIGHT SHOULDER.
If its an inverted head and shoulder pattern look to trade long at the RIGHT SHOULDER.
A pin bar or an engulfing candle formation at the right shoulder usually is the signal for an entry.
Stop loss should be placed above or below the set up candle.
And lastly, the best placement of the profit target is in the parallel side of the leg of the left shoulder.
See you in part 5!
No comments:
Post a Comment