It’s been a long time since I’ve posted my last winning trade. I’ve managed to record this fresh trade in the CADJPY forex pair this time and I want to share it with you.
With the help of my profitable forex trading strategy in the 4 hour time frame, I was able to find trade set up like this at least once a week.
It may sound boring to you to only have one trade set up a week but I’m here to tell that you don’t need to join every bit of the market’s movement to become profitable. Instead you chose your trade wisely and trade only when the state of the market greatly favors your bias.
One good metaphor of this is to trade like a sniper and not a machine gunner.
Don’t waste your bullets in every move of the market. Because the truth is that you only have limited bullets, reserved that shots for deserving targets or shall I say deserving trade set ups.
Enough said, let’s go on now to my successful trade.
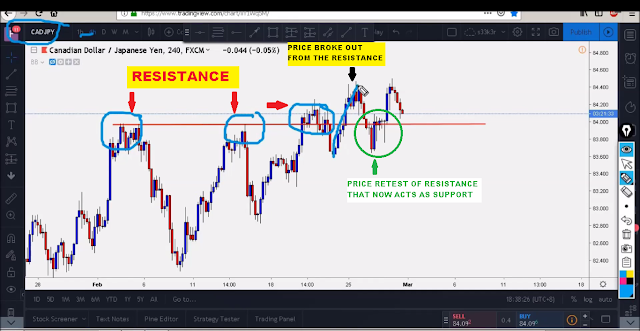
I have been eyeing the CADJPY pair when I saw that the price broke out from a clear resistance. Based on experience I know that broken resistance will act as a support when retested.
When the retest happened, it created the candle stick formations that serve as my signal to go in for a trade.
As you can see in the image below, no doubt it’s an uptrend in the 4 hour time frame because of the higher highs and higher lows formation.
Notice here that the price hit the resistance thrice before it finally broke out as indicated with the black arrow. I waited for the retest and saw that the support was holding as shown with green circle.
 |
| click the image to zoom in |
What I like about the retest in the support zone is that a BULLISH ENGULFING CANDLE was formed on it as encircled in the image below. That to me signifies that there are buyers in that area.
 |
| click image to zoom in |
I was still hesitant to take the trade because that for me is not enough for a trade entry. I need to follow my candle stick formation set up which is the combination of ENGULFINGS AND PIN BARS.
So I patiently waited and finally this BULLISH PIN BAR was formed yet again in that support area.
 |
| click the image to zoom in |
The formation of this bullish pin bar should have been my trigger for a trade entry. Unfortunately, I was not around when it formed and it was already too late for me to join the trade when I saw it.
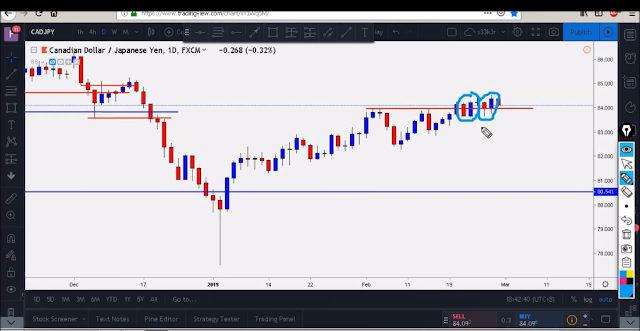
I don’t want to chase the price so I waited for the price to pullback. When I look at the daily chart, I noticed that there are two engulfing candles formed right at the resistance that I plotted in the 4 hour time frame.
 |
| click the image to zoom in |
This to me adds up another confirmation that there is a big probability that the price would go up. I’m really eager now to take an entry, so what I did was I put a buy order at the 50% retracement of the last daily candle.
The price pulled back the next day and triggered my entry point. The trade set up then looks like this in the 4 hour time frame.
 |
| click the image to zoom in |
Using the Fibonacci Retracement Tool I measured the last daily candle and put my entry point in the 50% Fibonacci retracement.
I then set my stop loss below the bullish pin bar formation.
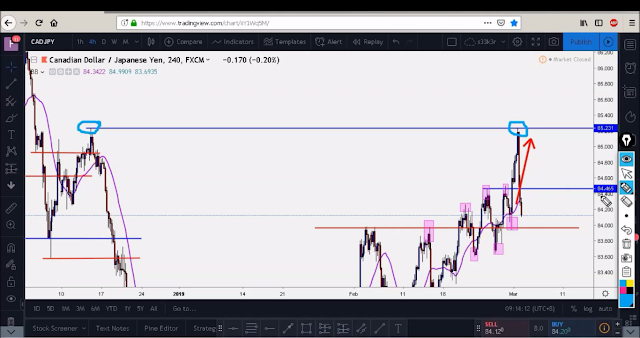
The most logical placement of my profit target would be the next known resistance in the daily time frame which is this zone as shown below.
 |
| click the image to zoom in |
Since our trade was already set, what we need to do now is to stay away from our computer and do something else. Looking at the chart regularly will only make us interfere with our trade.
Approximately 24 hours had passed and our profit target was hit!
I was really tempted to close my trade early because I noticed that there is an incoming big news in Canada about their GDP. Since we are trading the CADJPY forex pair the outcome of this news would affect our trade.
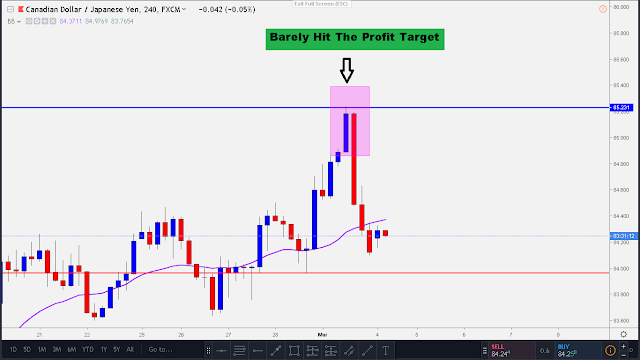
Luckily, the profit target was hit as shown in the image below. Just before the CAD news came out which is negative news for the CAD currency which then eventually made the price bearish.
 |
| click the image to zoom in |
 |
| click the image to zoom in |
Noticed that the profit target was just barely hit by the price before it burst downwards.
I am really happy about the outcome of this trade even though I’ve only managed to bank 2% ROI. I could have made a 1:3 risk to reward ratio if I managed to put on an entry immediately after that bullish pin bar was formed. This would be a lesson learned for me to be on watch always when this 4 hour candles formed.
Anyways, I managed to make an actual video of this trade. You can watch it here in my YouTube Channel, just follow this link : https://www.youtube.com/watch?v=KllJZhH9a5s
I hope you learned something from this long post.
Ciao!
No comments:
Post a Comment