Saturday, July 6, 2019

Head And Shoulder Pattern : A Profitable Trade Set Up in The Forex 4 Hour Time Frame

I am still posting my forex trade videos regularly here in my YouTube Channel but it has been a long time since I have written an article about the ideas behind my trades. So in this post I will be writing a much detailed reason why I took this HEAD AND SHOULDER forex trade in the 4 hour time frame.

 My 4 Hour Time Frame Forex Trading Strategy Set ups


If you read my previous trades and watched my videos, then perhaps you will now have an idea of what my forex trading strategies are using the 4 hour time frame. But for those who are new in this blog here it goes..

Combination Of Engulfing Candles and Pinbars that are formed in a key level

- This is just basically candles that engulfs or formed a pin bar at least 2 TIMES (the more the better) in a known support or resistance.

4 Hour Time Frame RSI Divergence

- In this strategy, I used the RSI Indicator as a guide to know if the current forex pair is forming a divergence movement.

Head and Shoulder Patterns in the 4 Hour Time Frame

- I think this is one of the most known forex trading set ups of all time because its very easy to recognize and trade.

-----------------------------------------------------------------------------------------------------

Recent Head and Shoulder Forex Trade in GBPUSD 4 Hour Time Frame


 Let me share with you a winning trade that I had with the use of the head and shoulder pattern set up in the 4 hour time frame.

Based on my experience, GBPUSD is a good forex pair to trade when such pattern is forming especially if it occurs in the 4 hour time frame.

As you can see in the image below, the price came back to its previous resistance area forming the LEFT SHOULDER along the way  and got rejected heavily as it tries to reach out more which then forms the HEAD.


By the time the price to move up again and almost leveled with the left shoulder, that's the time I took an entry. I know you might think its too early for me to take the entry but knowing that it is the GBPUSD which based on my experience is a good forex pair to trade when a head and shoulder pattern is forming I did not hesitate. Also, if you look at the charts regularly you will notice that GBP is really bearish this past few weeks.

I have my entry point figured out so I need to plan for my exit points. 
 My stop loss I placed just above the line of the resistance area that I plotted, while the profit target is placed right above the next support area where the price bounced.

My trade set up then look liked this:


Several candle had passed and it now looked like this below. By this time I was already confident that the HEAD AND SHOULDER formation that I was anticipating to occur  would really materialize. The combination of bearish engulfing and bearish pinbar candles to me indicates that the bears have won.


I had this trade set up with a risk-to-reward ratio of 1:3. Since I am risking 200$, I am assuming that I would win 600$ if my profit target will be reached.

After a couple of days later, finally my profit target was reached which by the way is the last trading day of the week. I'm just really glad that  finally its over and I can now move on again to find another profitable trade set ups.


This trade took several days before it finally reaches my profit target. I am no expert in forex trading, I also have losses but with a good trading plan and strategy I still managed to gain something from the forex market..

And with that let me end this article with this quote..

" Plan your trades, and trade your plans"

If you wish to watch the live video of this trade you can go to this link and watch it :)

Saturday, April 6, 2019

Forex Strategy Using The RSI Indicator : My New Strategy

I had my ups and downs trading forex for more than two years. It all becomes stable only when I finally decided to create a trading plan. 

This trading plan covers all the rules that I should abide and follow in order for me to become successful at this endeavor. 

One specific rule that I follow is my trading strategy. It took months before I derived the strategy that I am currently using. But as time goes by, I noticed something about the chart patterns and I've come up with a new strategy with the use of the RSI indicator.

I am not replacing my old strategy, I am just adding a new strategy and currently I am still in the process of knowing its winning probability. 

So far the strategy is just very simple and can be learned by beginning forex trader almost instantly.

To give an example about my strategy I will be showing here my last trade in the GBPCAD in the 4 hour time frame.

 I forgot to mention that this strategy, I only tested it in the 4 hour time frame. I love the 4 hour time frame because its just gives me good set ups and time allowance to join these set ups before the price moves towards my desired direction.

Enough with the chitchat lets go on now to my winning trade using my new strategy. 

MY SIMPLE STRATEGY IN THE 4 HOUR TIME FRAME USING THE RSI INDICATOR


First thing to do with this strategy is to of course display your RSI Indicator in the chart. Usually the RSI indicator will appear at the bottom of the chart. 

With this strategy, I am using the default setting of the RSI.

The logic behind this strategy is just very simple. All you have to do is to plot a support and/or resistance in the RSI chart together with the price chart.

As you can see in the image above, I've already plotted a resistance in the RSI graph and also in the price chart as indicated with the red line.

Notice here that in the RSI graph, the resistance line that I plotted was going downwards. But in the price chart, the resistance line that I plotted was going up.

There's something fishy here. Because supposed to be, the RSI graph should mimic the movement of the price chart. But in this case its not. 

The thing that happened here is often called by traders as a divergence set up. There has been a divergence between the RSI graph and the price chart.

If you found set ups like this, then its good to trade the direction of what the RSI Indicator is showing us and that direction is a bearish movement.

SHORT ENTRY USING THE RSI STRATEGY


  1. As you can see in the chart below, I entered the trade immediately.
  2. My stop loss placement would then be placed at the top of the resistance line.
  3. My profit target is set in the support line area. 
So my trade set up now would look like this below.
 

TESTING THE TRADER'S PSYCHOLOGY


The trade is already executed and all I had to do is to wait and let the market do its thing.

Finally, our profit target was hit. It took days before the price reach my profit target.

This trade really did become a marathon to me because the price was really all over the place but luckily I just held on to my position.

Notice below that the price tried to break and tested again the resistance in the RSI Indicator before it burst downwards. 

This moment right here is the hardest moments of all traders. Its really tough to watch the price coming back against you that is why I keep myself away from the screen to avoid being emotional.


If you trust your strategy, then there is no need to panic even if the price came back to breakeven point.

This trade gave me almost a 1:4 risk to reward ratio.. Another profitable trade for me using a new strategy.

The strategy is still under probation shall I say. But so far so good.

In my next trades, I have decided to increase my risk to 2% to 3% depending on the set up. I think I am ready and hopefully I would be able to handle the psychology and emotion behind it.

If you wish to watch the live video of this trade you can go to this link and watch it :)


Friday, March 15, 2019

Forex Strategy That Works In The 4 Hour Time Frame

Slowly but surely my capital every week increases. 

But that’s only possible through dedication and discipline in following my forex trading strategy that works in the 4 hour time frame.
 It’s better like that because I avoid over trading.

  Overtrading is one of the reasons why most of the traders fail.


My defense is my best offense in the market.

Trading only on a minimum of once a week not only keeps me away from overtrading, it also gives me control over my emotion towards the market.

Don’t be afraid of missing out opportunities because the market is not going anywhere.

Stick to your strategy and patiently wait for your trading set ups to arise before you take an entry

Just like what I’m doing, I patiently wait and wait and wait for my set ups to occur before I decide to join in.

Enough said, let’s go on now to my 1:3 risk-to-reward winning trade in NZDCHF.


Using the same forex trading strategy in the 4 hour time frame consistently


I just want to say that I am literally using the same strategy over and over again in the market. Same set up, same plan, same risk to reward ratio set up, everything the same. Only that it varies on the forex currency pair that I trade on.

 Plotting support or resistance key areas


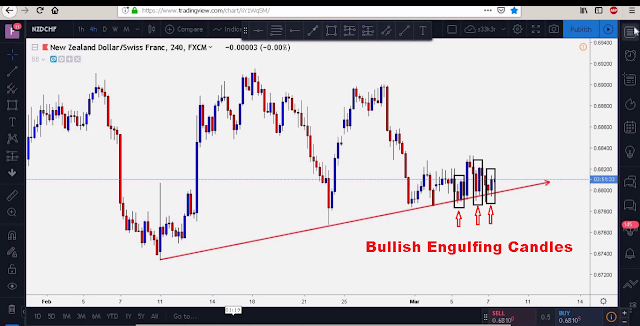
This is the first thing that I always do with the charts in the 4 hour time frame. I plot key support and resistance and wait for the price to make a move on those areas. This support or resistance key areas may be a horizontal line or in this case in NZDCHF  a support trend line as shown below.

key support and resistance
click the image to zoom in

Japanese candle Stick Formations Setup


The second thing I do then is to look for or sometimes wait for Japanese candle stick set ups to form in this key support or resistance area that I plot.

Using my own strategy, I need to wait for a combination of engulfing candles and/or pin bars.

In short my set up candles are engulfing candles and pin bars, but note that I said also that this candle stick formations needs to be formed right at a KEY AREA.

I don’t just randomly trade engulfing candles and pin bars, it needs to be formed in a key area as well.

And if we look at the image below, there are three bullish engulfing candles formed right at the trend line support that I plotted.

bullish engulfing candles
click the image to zoom in


Planning for the risk-to-reward ratio


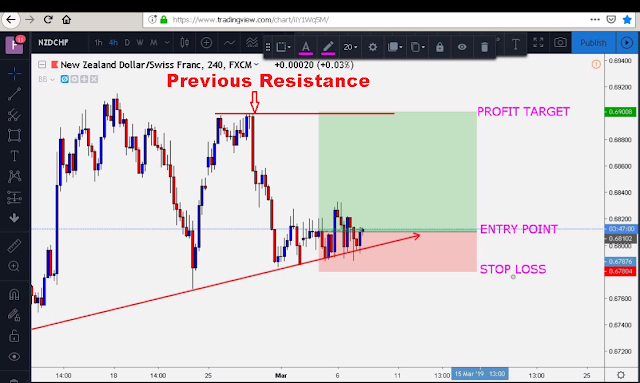
  • Entry Point - This combination of three engulfing candles that are formed right at the support is my final clue for an entry trade. Of course you can wait for a little bit of pullback but in my case here I put an entry immediately upon seeing this 3rd bullish engulfing formed.

  • Logical Stop Loss Point - My stop loss placement is right below those bullish engulfing candles and the support line. I needed to widen my stop loss so that I can give some space for the price to move in and out. Also, it is much safer down below that area because buyers are positioned there to reject the price.

  • Profit target placement- As you may see in the image below, there is a clear previous resistance that formed.Since this bullish trade set up looks so strong with the presence of the support trend line and 3 bullish engulfing candles, I will place my profit target right at the resistance zone.

The final trade set up would then look like this below.

final trade set up
click the image to zoom in

Forex psychological stage a.k.a the waiting stage


Entry point, stop loss and profit target all secured. I evaluated the trade set up and I perfectly followed my forex trading strategy 100%.

My plan and strategy is already fixed and constant. The only problem now is my own psychology and emotion towards my trade.

That is why I set my trade and walk away from it. Not only that I avoid stressing about it but also I kept myself from interfering from it.

I will have no regrets if this turns out to be a losing trade because I followed my plan, I followed my strategy, 
I followed my system. I also accepted the fact that my strategy is not a 100% win rate and so I will have losses.


 BUT GUESS WHAT HAPPENS WHEN PREPARATION MEETS OPPORTUNITY? 


when preparation meets opportunity
click the image to zoom in

Yes, my profit target was hit and I gained 3% profits.

After almost 3 trading days the price finally reached out for my profit target.

Every time I have a winning trade like this it makes me more confident and trusting more on my trading strategy.

I managed to make an actual video of this trade here in my YouTube Channel. If you like you can watch this live video right here : https://www.youtube.com/watch?v=d6fMJ40uGxY

You can subscribe to my channel and browse my videos and you will see how my strategy evolved  from just a simple set up to up until to what it is now.


More power to you!

Thursday, March 7, 2019

2 Biggest Misconception About Forex Trading As A Career


People are drawn towards forex trading because of the idea of a promising career where you could acquire big amounts of money with minimal work involve.
 
 When I say minimal work involve I am talking about staying at home and sitting in front of your computer watching charts.
 
I know we all dream that kind of job where in we feel free, not pressured, no boss to report to, can spend more time with family and best of all a job that makes us financially free in our entire lives.
 
Becoming a professional forex trader is one of the few career paths we could choose to achieve this goal in life. But I’m telling you now that it’s not gonna be an easy path as what you have heard and watched in YouTube.
 
Here are two misconceptions about trading the currency market which I think attracted people and made them willing to gamble money in the market.

 ------------------------------------ 
 

1. The thought that forex trading is the answer to all financial problems we are facing.

 
If you search forex trading in YouTube you could see some traders posting big gains from trading forex instantly.
 
Gaining BIG MONEY ALMOST INSTANTLY sparks our interests about it and activates the optimistic side of our brain thinking if that guy could do it why can’t we?
 
But you know in forex trading you will need to have money to earn more money.
 

Trading the financial market is the biggest online casino in the world.

 
In short, trading is gambling. The thought that you have financial problems should be enough reason why you should not engage in trading. Because as what the famous saying says about gambling,
 “The House Always Wins”.
 
If you are facing financial problems and barely just have enough money to live day by day then you should not engage in trading. Don’t think that this will be the solution to your problem, because it’s not gonna happen. Instead, it will just ruin you more and will lead you to a more depressing life.
 
Don’t use your life savings in trading the market because you will not be able to handle the stress and emotion that goes with it.
 
I’m not discouraging you to trade forex but it’s just really is the reality. If you really want to try trading, then you need to allocate a certain amount of money that you are comfortable losing.
 
That’s right, it’s not a quick rich scheme. If somebody is posting such big gains in just a matter of days in the internet that looks too good to be true then it may be not true.
 
Don’t be blinded by the potential gains you could earn, you have to think about the risk as well.
 
Success in forex trading takes time as well. It takes years to be profitable in this field.
 
Just like all the other careers in the world, it takes time to become a pro.
 
So don’t think that this career shift would suddenly end your financial problems.
 
------------------------------------ 

2. The thought that its easy to become profitable in forex trading

 
Forex trading is simple, but it’s not easy.
 
It’s simple in a sense that all you have to do to earn money from it is to buy and sell the currency market. 
 
It’s easy because everyone can trade without any educational background. It’s easy because it feels just like playing a regular pc game when you are looking at the charts.
 
And because of these reasons we tend to underestimate it which makes us vulnerable in the market.
 

Forex trading is a psychological game

 
When you already started trading the market you probably think that it’s the market that you need to beat. 
 
But the truth is that it’s YOU, yourself that you need to conquer.
 
In this game you will need to handle your emotions well.
 
You will need to understand that this is a numbers game as well.
 
Every trade you take in the market has a random outcome. That means you will have a series of winning trades and losing trades.
 
When you are having a winning trade then that’s good, but when you are in the time of experiencing a series of losing trade then will you be able to handle the frustration and stress?
 
Would you still stick to your strategy? Would you still stick with your game plan?
 
It is reported that 90% to 95% of all traders in the entire world fails.
 
Only the remaining 5 % – 10% remaining are the ones who are profitable. Why is that?
 
Clearly it’s all because of the discipline factor of every trader. If only intelligence were the basis of trading then there would be plenty people making money from the market. But this is not the case.
 
Most failed because of greed and fear of the market. This then leads to anger and depression.
 
Taking a trade in these emotional states is very risky because most of the times we can’t think logically when we are more driven by these negative emotions.
 
These are the two thoughts that I think is the biggest misconceptions about the forex market.
 
I hope you learned something about this article and if you wish to learn about my profitable forex trading strategy in the 4 hour time frame you can just visit my YouTube Channel and watch my live trade videos.

Monday, March 4, 2019

My Forex Win Trade : CADJPY In The 4 Hour TIme Frame


It’s been a long time since I’ve posted my last winning trade. I’ve managed to record this fresh trade in the CADJPY forex pair this time and I want to share it with you.
 
With the help of my profitable forex trading strategy in the 4 hour time frame, I was able to find trade set up like this at least once a week.
 
It may sound boring to you to only have one trade set up a week but I’m here to tell that you don’t need to join every bit of the market’s movement to become profitable. Instead you chose your trade wisely and trade only when the state of the market greatly favors your bias.
 

One good metaphor of this is to trade like a sniper and not a machine gunner.


Don’t waste your bullets in every move of the market. Because the truth is that you only have limited bullets, reserved that shots for deserving targets or shall I say deserving trade set ups.
 
Enough said, let’s go on now to my successful trade.
 
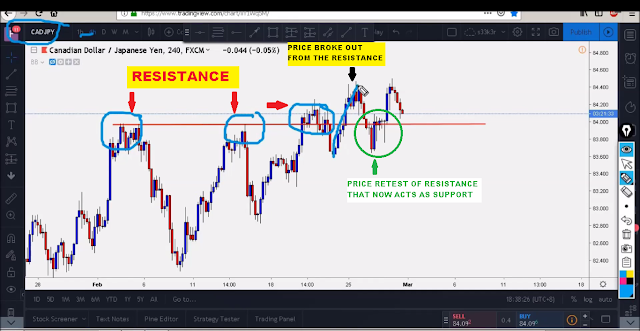
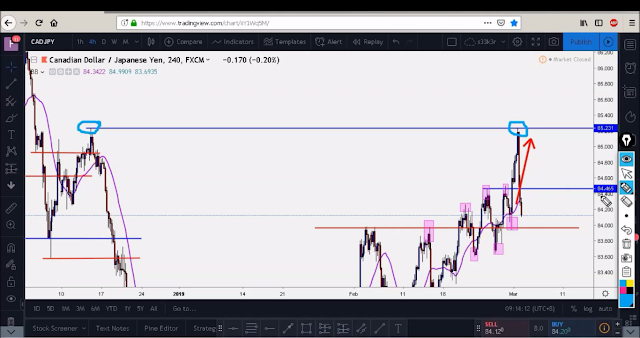
I have been eyeing the CADJPY pair when I saw that the price broke out from a clear resistance. Based on experience I know that broken resistance will act as a support when retested.
 
When the retest happened, it created the candle stick formations that serve as my signal to go in for a trade.
 
As you can see in the image below, no doubt it’s an uptrend in the 4 hour time frame because of the higher highs and higher lows formation.
 
Notice here that the price hit the resistance thrice before it finally broke out as indicated with the black arrow. I waited for the retest and saw that the support was holding as shown with green circle.
 
resistance becomes support
click the image to zoom in


What I like about the retest in the support zone is that a BULLISH ENGULFING CANDLE was formed on it as encircled in the image below. That to me signifies that there are buyers in that area. 

bullish engulfing candle at support
click image to zoom in

I was still hesitant to take the trade because that for me is not enough for a trade entry. I need to follow my candle stick formation set up which is the combination of ENGULFINGS AND PIN BARS.
So I patiently waited and finally this BULLISH PIN BAR was formed yet again in that support area.
 
bullish pinbar at support
click the image to zoom in

The formation of this bullish pin bar should have been my trigger for a trade entry. Unfortunately, I was not around when it formed and it was already too late for me to join the trade when I saw it.

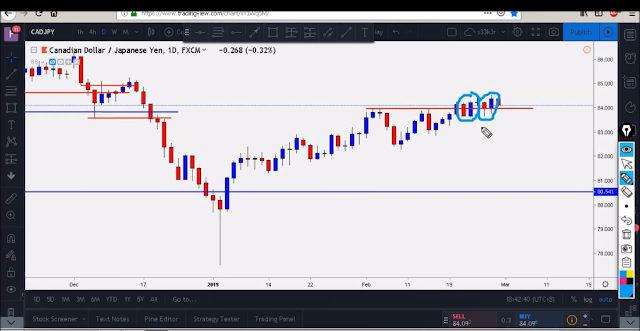
I don’t want to chase the price so I waited for the price to pullback. When I look at the daily chart, I noticed that there are two engulfing candles formed right at the resistance that I plotted in the 4 hour time frame.
 
double bullish engulfing in daily chart
click the image to zoom in


This to me adds up another confirmation that there is a big probability that the price would go up. I’m really eager now to take an entry, so what I did was I put a buy order at the 50% retracement of the last daily candle.
 
The price pulled back the next day and triggered my entry point. The trade set up then looks like this in the 4 hour time frame.
 
trade set up from retracement
click the image to zoom in

Using the Fibonacci Retracement Tool I measured the last daily candle and put my entry point in the 50% Fibonacci retracement.
 
I then set my stop loss below the bullish pin bar formation.
 
The most logical placement of my profit target would be the next known resistance in the daily time frame which is this zone as shown below.
 
profit target placement
click the image to zoom in

Since our trade was already set, what we need to do now is to stay away from our computer and do something else. Looking at the chart regularly will only make us interfere with our trade.
 

Approximately 24 hours had passed and our profit target was hit!


I was really tempted to close my trade early because I noticed that there is an incoming big news in Canada about their GDP.  Since we are trading the CADJPY forex pair the outcome of this news would affect our trade.
 
Luckily, the profit target was hit as shown in the image below. Just before the CAD news came out which is negative news for the CAD currency which then eventually made the price bearish.
 
profit target hit daily chart
click the image to zoom in

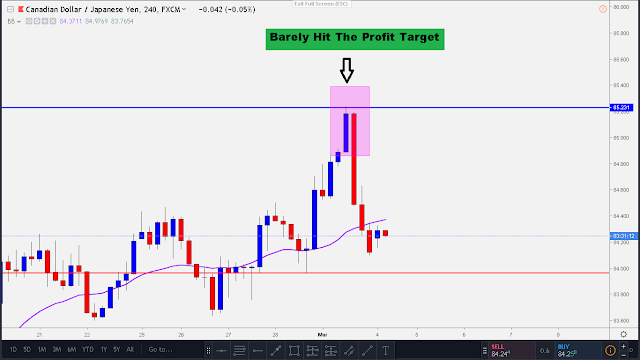
profit target hit in 4 hour time frame
click the image to zoom in

Noticed that the profit target was just barely hit by the price before it burst downwards.
 
I am really happy about the outcome of this trade even though I’ve only managed to bank 2% ROI. I could have made a 1:3 risk to reward ratio if I managed to put on an entry immediately after that bullish pin bar was formed. This would be a lesson learned for me to be on watch always when this 4 hour candles formed.
 
Anyways, I managed to make an actual video of this trade. You can watch it here in my YouTube Channel, just follow this link : https://www.youtube.com/watch?v=KllJZhH9a5s
 
I hope you learned something from this long post.

 Ciao!

Friday, March 1, 2019

Technical Analysis For Beginners Part 6: How To Use Fibonacci Retracement Tool Effectively


fibonacci retracement level

As you have noticed about the price movement of the currency market, it does not move in a straight line.
 
Instead the market goes in a wave pattern. The wave pattern is composed of an impulse and a correction move which happens endlessly and over and over again.
 
Eventually this correction move in the market can be sometimes predicted by the use of a retracement tool which is called the Fibonacci Retracement Tool.
 
This Italian mathematician discovered this Fibonacci sequence which he calls the golden ratio and considered to be the natural order of all things.
 
To make the long story short, traders understood that the Fibonacci levels can be applied in the forex market.
 
By the use of the Fibonacci Retracement Tool traders can now somewhat predict the movement of the market when the price retraces back before continuing its trend.
 
This price retracement in the market can sometimes be referred to as the pullback of prices. We can think of the wave impulse as inhaling and the retracement as exhaling of the market.
 
Let’s cut the chase and get to the point now.


How to use Fibonacci retracement in forex effectively?


Based on my own experience, Fibonacci retracement levels works effectively when applied in a clear trending market. There are traders who based their trading system on trend following and by the use of this Fibonacci levels they are able to ride the trend effectively.
 
In the examples below I will share with you how to use the Fibonacci levels as a way to make an entry to join a trending market. I will be using the 4 hour time frame since I based my strategy here and we will be focusing on the golden ratio which is the 0.618 Fibonacci level.


As what I have said before, we can only use the Fibonacci retracement tool effectively when it is applied in a clear trending market.
 
clear uptrend forex market
click the image to zoom in

How to use Fibonacci retracement levels in an up trending market?


The chart above is the CADJPY forex pair in the 4 hour time frame. Looking at the chart we could see a series of higher highs and higher lows which indicates that the market is moving in an up trending fashion.
 
Since this is an up trending market we are only be looking for a buying set up.
 
We need to look for a pattern where in there is an impulse move followed by a retracement move as what I have indicated with the ABC labels.
 
The A ---> B movement is what we call the IMPULSE MOVE.
 
The B ---> C movement is what we call the RETRACEMENT MOVE.
 
uptrend fibonacci retracement
click the image to zoom in
 
Now if we put on the Fibonacci retracement tool and zoom in, it would then look like this.

 
Note that I am assuming here that you already know how to position the Fibonacci retracement tool in the chart.
 
But for those who don’t know, just look for the Fibonacci retracement tool in your platform which looks like this symbol encircled with green in the image above. You then need to click first the start of the impulse which is the point A and then drag the mouse cursor over to point B to make the fib retracement position the same with the image that I used.
 
The price retraced back to the 0.618 Fibonacci level before it continued to go up. It’s like the market inhaled ( impulse move ) and exhaled ( retracement move ) for a bit before it burst upward and continue the trend.
 
By using the Fibonacci retracement tool we were able to predict where the market would end up retracing.
 
Noticed also that in the 0.618 fib level a small bullish pin bar was formed which gives us a signal and a set up to go long.
 
Another example below for a down trending market.
 
clear downtrend forex market
click the image to zoom in

How to use Fibonacci retracement levels in a downtrending market?


Again, our first step would be to look for a market that has a clear trend for us to be able to use the Fibonacci retracement tool effectively.
 
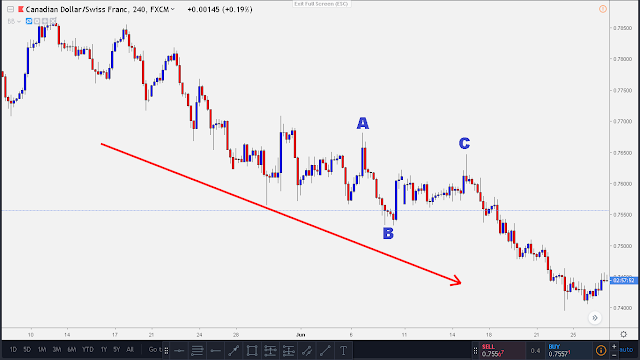
This forex pair is the CADCHF in the 4 hour time frame. We could say that it is an obvious down trending market, that’s why we will be only looking for a selling opportunity here.
 
The only part that needs focus and attention here is the part where you will be looking for the ABC pattern. Eventually, if you put more time on studying charts all of this will become much easier to find.
 
Assuming that we found this ABC pattern already, and we then position our Fibonacci retracement tool from point A to point B. The set up will then look like this below.

 
downtrend fibonacci retracement
click the image to zoom in

Look how powerful the 0.618 Fibonacci level is. The price tried to go up in that area but it was clearly rejected and formed a big bearish pin bar which for me is a strong indication that the down trend is going to continue which it actually did.
 
We could have entered this bearish set up right away after the formation of this red pin bar and locked in big rewards as we ride the trend downwards.
 
There is no doubt that there is some truth about the phrase “the trend is your friend”. It’s just a matter of strategy and techniques on how we can benefit from it.
 
Finally I was able to put out all my thoughts about this technical analysis for beginners article series. I hope that somehow you guys learned something from it.
 
I know there are still a lot to be learned about forex trading but it’s okay because we are gonna be taking it slow but steady.
 
Forex trading is a marathon and not a sprint, so let’s make sure that we have enough gas for the finish line.
 
See you in my next post!

Wednesday, February 27, 2019

Technical Analysis For Beginners Part 5: How To Trade The Hidden Divergence in Forex

The divergence that forms in the forex market is one of the set ups that many traders look for from time to time. The same with the head and shoulder pattern, it doesn’t show up all the time but when it does, it gives traders a big upper hand over the market.

Divergence is a situation in the market where in the price chart shows a certain direction of the price but the technical indicator such as the Relative Strength Index or RSI shows the opposite direction.

Technical indicators are supposed to mimic the movement of price but in the case of a hidden divergence it shows a different outcome. Seeing this in the chart will make you think that there is something fishy about the market. This abnormality translates to forex trading as a reversal of the current price movement.

To make this all clear and less confusing, I will show you some examples of hidden divergence in the forex market that are hard to see if you don’t know where to look. Divergence in the market occurs on any time frame but in the examples I will be using the 4 hour time frame.

Also, the technical indicator that I will be using is the RSI with its default settings.

There are two types of divergence in the forex market; the bullish divergence and the bearish divergence


  1. Traders call it bullish divergence when the price action is bearish or down trending but the technical indicator which is the RSI is showing a bullish move or a consolidating move defying the real movement of price which is supposed to be a bearish move.
     
  2. Traders call it bearish divergence when the price action is bullish or up trending but the RSI is showing a bearish move or a consolidating move defying the real movement of price which is supposed to be a bullish move.

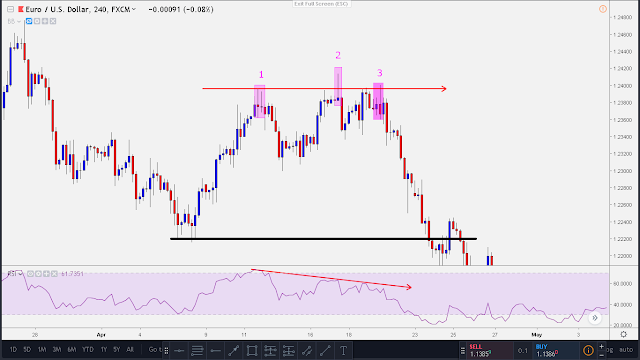
Bearish divergence example in the EURUSD forex pair in the 4 hour time frame


forex bearish divergence
Click the image to zoom in..

Observe that the price is basically showing a sideways direction with a somewhat bullish bias as it created a higher high indicated with the number 2.

But look at the RSI indicator below.

What have you noticed? 

The RSI indicator was showing a different data, it is clearly showing us a down 
trending graph as indicated with the red arrow going down.

This is how a bearish divergence looks like! Two graphs ( price graph and RSI graph ) showing different facts that are supposed to be the same.

The question now is this..

How to trade this divergence forex set up?


We could confirm that this is a divergence when both graph showing contradicting movements.
All we have to do after that is to wait for a candle stick set up for an entry. We need to wait for a candle stick set up so that we can plan our entry and stop loss point.

Seeing that bearish pin bar formed as indicated with number 3, we can now put on our entry point and stop loss.

Our entry point would be right after the pin bar formed or perhaps you could wait for a little bit of pullback.

Our stop loss placement would then be above that bearish pin bar.

Our logical placement of the profit target would be right at the previous resistance as shown with the black horizontal line.

The final set up of the trade would look like this

forex bearish divergence set up
Click the image to zoom in


I don’t know if there are forex divergence scanner out there but what happened with the market after just shows us how powerful and profitable bearish divergence set up could be if traded correctly. In this particular trade it could have been an easy 1:4 risk to reward ratio winning trade.

 Bullish divergence example in the EURGBP forex pair in the 4 hour time frame


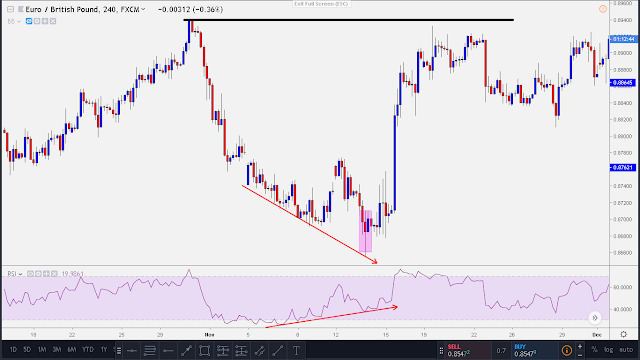
 In this pair we could see that the price chart is showing us a down trending price. But when we look at the RSI graph below it, we could clearly see that the graph is showing an uptrend movement as indicated with an upward pointing arrow.
forex bullish divergence
Click the image to zoom in

With these we could confirm that this forex pair at this particular time is bullish divergence.
Since this is confirmed already, we can now use our divergence forex system strategy set up.

We wait for a candle stick formation that signals a start of a bullish move.

Observe that a bullish pinbar formed followed by a bullish engulfing candle as indicated with the magenta rectangle.

Our entry point would then be right after that bullish engulfing candle and we put our stop loss below the pin bar.

The logical placement of the profit target would be below the resistance as indicated with the horizontal black line.

The final forex divergence trade set up would look like this

forex bullish divergence set up
Click the image to zoom in

This trade here could easily give us a 1:4 risk to reward ratio.

Forex divergence trade set up combined with a reliable candle stick formation will not only  give us a great edge in the market but also big profits.

Patiently scan your chart for these kinds of patterns and you will be rewarded.

The big question is that are you willing to wait for this kind of patterns to occur in the market?
See you in the last and final part of this article series!

Tuesday, February 12, 2019

Technical Analysis For Beginners Part 4: Trading The Ever Famous Head and Shoulder Pattern

Price action formations in the FOREX market seems very random to starting traders. I remember when I first look at a chart 2 years ago I could not mentally form any formation at all.

All seems to be just random ups and downs of the flow of the market. Never did I realize that the ebb and flow of the market is all driven by people’s psychology.

Later on as I put more time in studying and observing how the market moves, I came to conclude that there are certain patterns formed repeatedly.

In this part 4 of these article series, I want to talk about the ever famous head and shoulder pattern formations.


It’s undeniable that there are many patterns out there but this pattern formation is the most or if not one of the most pattern formation traders looked for in the market.

Why do traders look for this head and shoulder patterns?


  • First of all it’s easy to recognize because of its obvious formation.
  • Second reason is that this set up has a huge probability of forming which means it has high win rate.
  • The final reason is that depending on how the pattern forms it usually gives good risk to reward ratio.

Take a look at our example below.

head and shoulder pattern in 4 hr time frame
Click the image to zoom in

This head and shoulder pattern formed in the EURNZD 4 hour time frame. 

As you can see, this pattern formation is quite obvious. Derived from its name itself it is composed of two shoulders and one head..


head and shoulder trade set up
Click the image to zoom in
On trading this kind of pattern, its is best traded right at the formation of the right shoulder. As you can see in the example above. There is a bearish pin bar set up formed in the right shoulder. 

Entry point would be right after this pin bar formed. 

The stop loss should be placed above the pin bar.

The most logical place for the profit target would be the bottom of the left shoulder which is a known support indicated with a red horizontal line.

This trade set up using the head and shoulder pattern alone could have generated a good 1:6 risk to reward ratio.

The inverted head and shoulder pattern


The inverted head and shoulder pattern is pretty much the same with the usual head and shoulder pattern. It just that this formed in reversed form but mind you  the concept is still the same.

inverted head and shoulder pattern
Click the image to zoom in
This inverted head and shoulder pattern was formed in the NZDUSD pair 4 hour time frame.

In the eyes of those novice traders this might look hard to recognize as a pattern. But the more you put time on studying charts there will come a time when you will be able to recognize this patterns almost instantly.

Since this is an inverted one we should be looking for a set up here to go long. In my own style of trading, the set up would go like this.

inverted head and shoulder trade set up
Click the image to zoom in

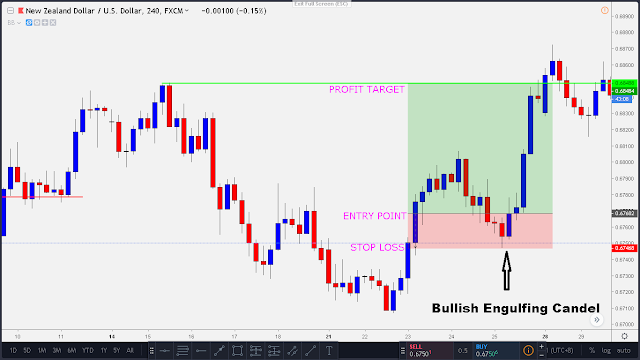
As I have talk about in my previous article about Japanese candle stick formation where the topic is about engulfing candles and its psychology. This bullish engulfing candle here could be our signal that the price would be bullish and will form the inverted pattern.

Our entry would be right after the bullish engulfing candle formation.

Our stop loss must be placed below the candle that had been engulfed.

Our profit target again should be based on the pattern itself. In this inverted one it should be placed at the top of the leg of the left shoulder which is a known resistance indicated with a green horizontal line.

In this particular trade set up, we could have had easily generated a 1:4 risk to reward ratio winning trade.

In summary of this article.

Head and shoulder pattern is literary composed of a HEAD and a SHOULDER which makes it easy to recognize.

If its a usual head and shoulder pattern, look to trade short right at the formation of the RIGHT SHOULDER.

If its an inverted head and shoulder pattern look to trade long at the RIGHT SHOULDER. 

A pin bar or an engulfing candle formation at the right shoulder usually is the signal for an entry.

Stop loss should be placed above or below the set up candle.

And lastly, the best placement of the profit target is in the parallel side of the leg of the left shoulder.


See you in part 5!